 WaiMAP
Detect Change. Understand Impact. Act Earlier.
Watch your sites from a reference date: what changed in the mapping, which events happened nearby, what the drone surveys show — each observation with its source and date, to verify on site.
For: Asset owners and O&M teams, environmental and permitting teams, lenders' monitors, public bodies
What you give WaiMAP
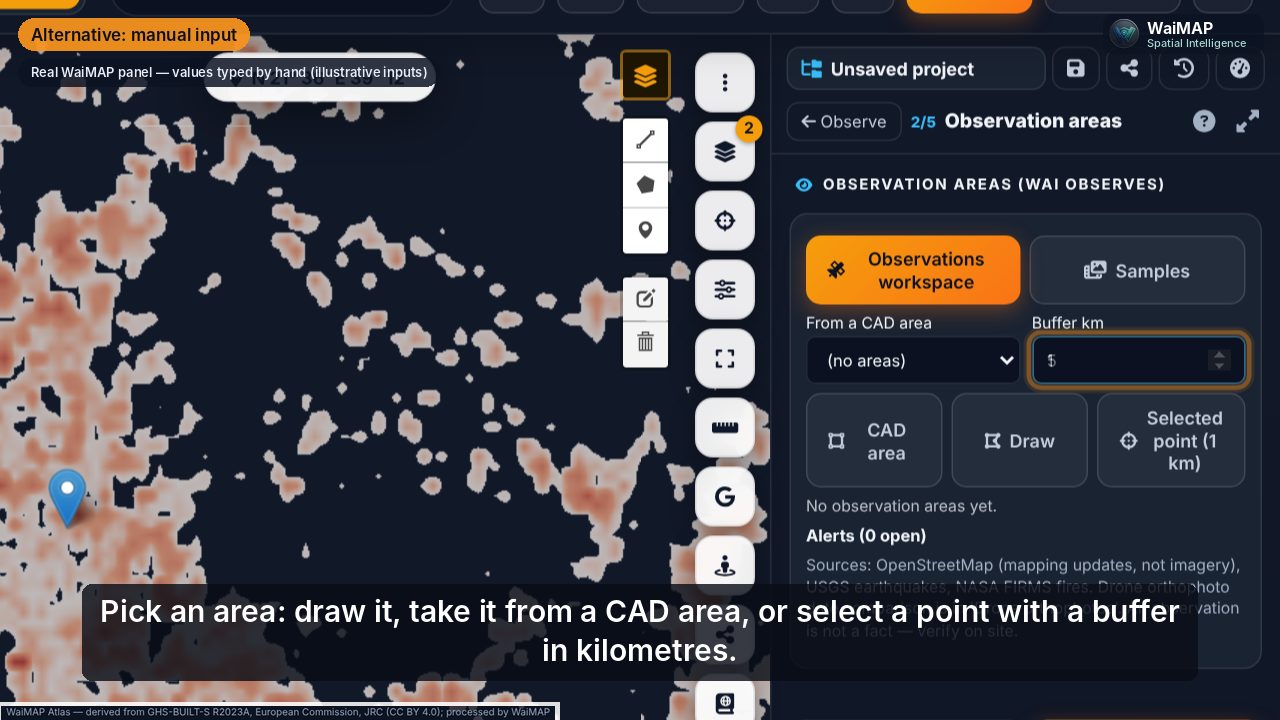
- An observation area and a reference date
- Two images, orthophotos or maps to compare (or the built-in sources)
- Your sector rules
What it does
Automatic
- Historic maps, NASA two-date imagery, GHS-BUILT-S growth 1975–2030 side by side, swipe or blend
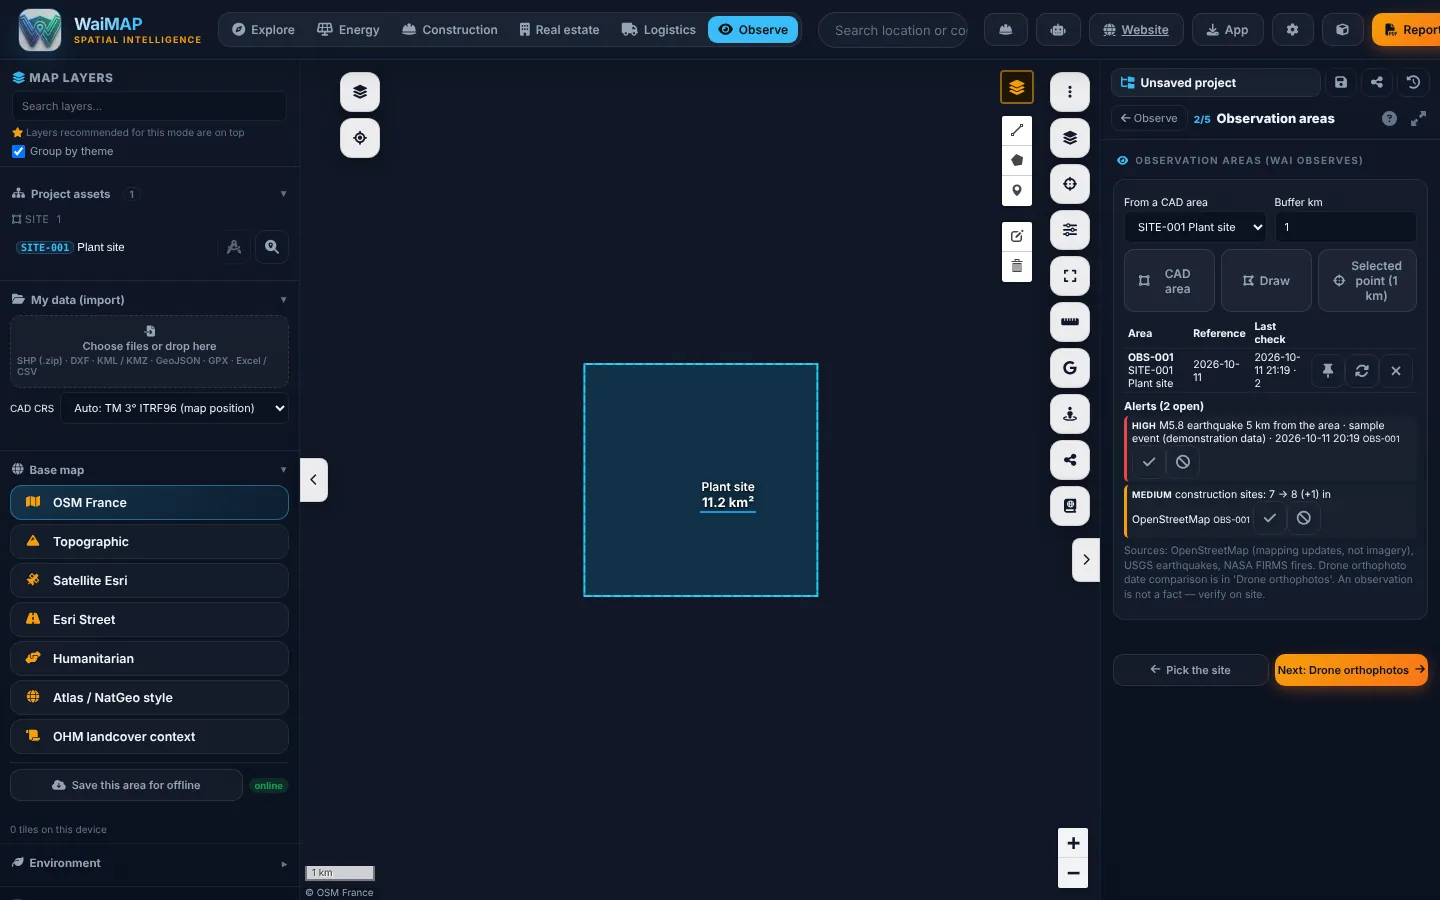
- Mapping changes, earthquakes, active fires, flood screening around the site
- Change polygons with class, area, confidence and a needs-verification flag
- Design vs as-built volumes, progress and S-curve; corridor vegetation and PV anomaly screening
Manual input
- Accept, reject or reclassify each change (human review)
- Confirm alerts on site before acting
What you get
- Observations report with accepted changes only
- Change polygons and work orders (Excel)
- Observation alerts per area
Planned
- Thermal inspections and predictive maintenance (rolling out, Enterprise)
- Scheduled automatic checks and e-mail notifications
- Traffic and maritime feeds
Demonstration project
Demonstration project (generated with WaiMAP engines)
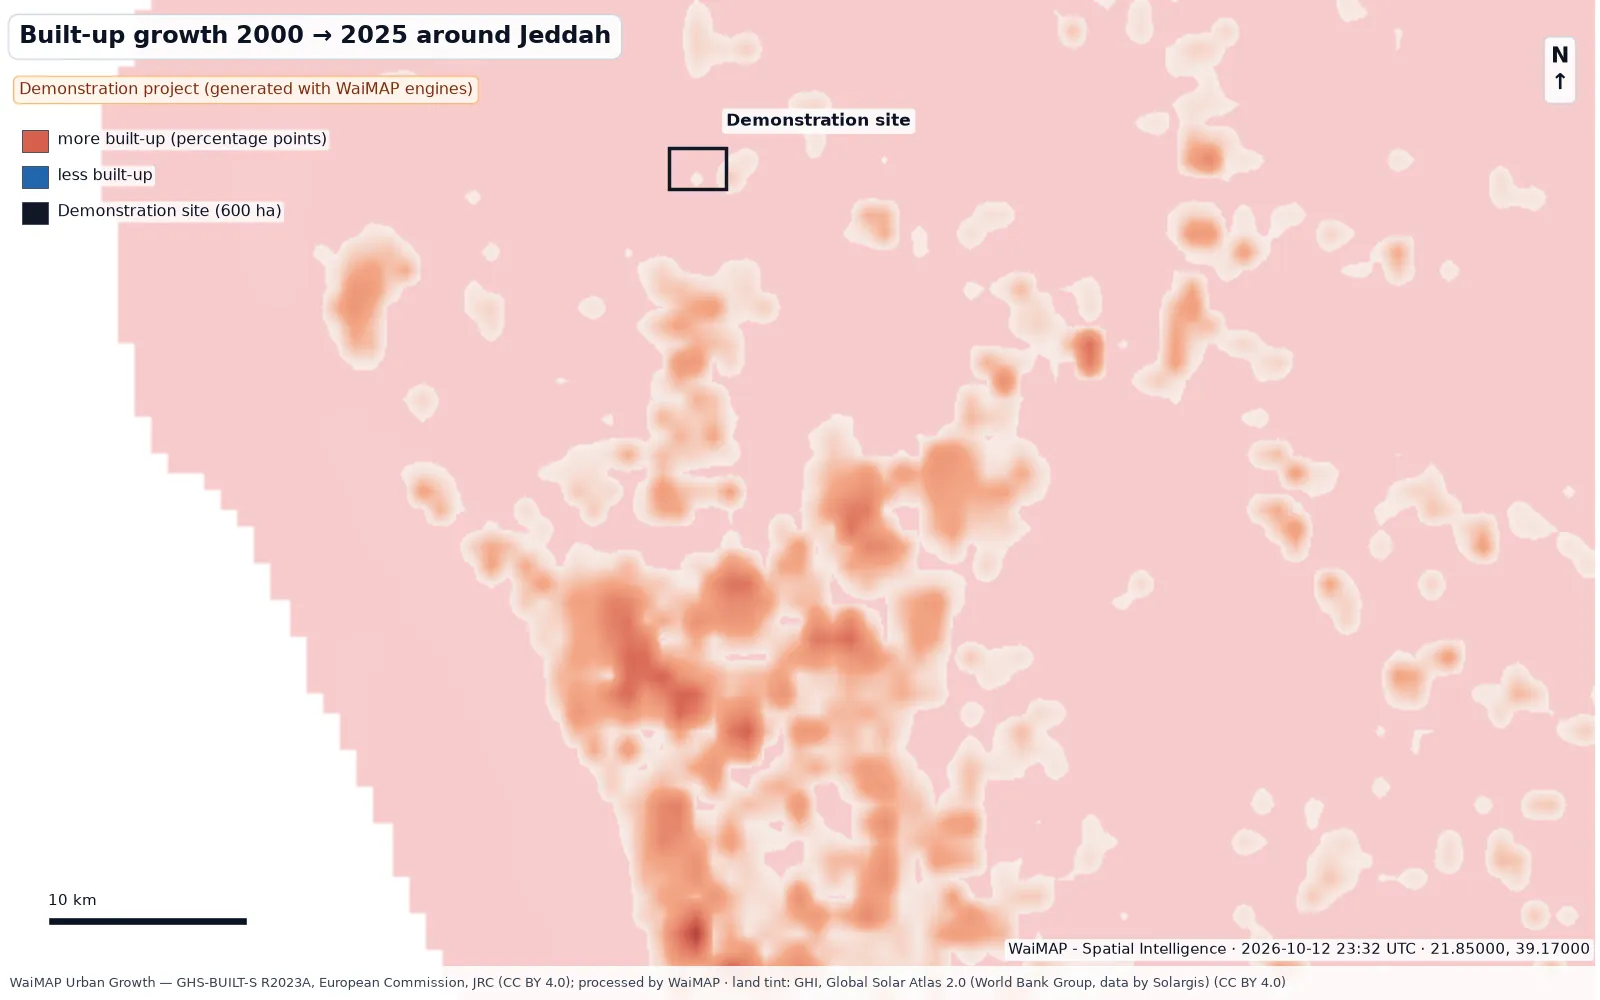
Red Sea coastal development – Jeddah area (demonstration)
A 600 ha mixed-use district scenario on the Red Sea coastal plain: land budget, utilities, indicative cost, solar resource and rooftop PV, flood exposure, urban growth and access — screened with the WaiMAP engines.
Video
 Video coming soon
Videos are published after review. Video centre
Who it is for
- Asset owners and O&M teams
- Environmental and permitting teams
- Construction managers and lenders' monitors
- Public bodies and planners
Key output: What changed, where, how much and when — with a confidence score and a needs-verification flag; observations to verify, not facts.
How it works
Observe
Observation areas and a time-line of every source: base maps, historical maps, georeferenced plans, drone orthophotos, built-up epochs, surveys and designs.
Compare
Two dates side by side, by swipe or by blending; the current state against the reference or the design.
Interpret
What changed, where, how much and when — class, area, confidence and a needs-verification flag; sector priority rules and human review.
Alert & Report
Alert rules on demand, work orders and the Observations report with accepted changes only.
Use cases
Environmental and forest monitoring
Protected areas (Natura 2000), forests and wetlands around the site; ESA WorldCover land cover and a Sentinel-2 cloudless background.
Floods, fires and hazards
Active fires (NASA FIRMS, last 2 days when a key is set), earthquakes (USGS), flood screening from GloFAS river discharge along routes and at sites.
Construction progress
Design vs as-built: cut / fill between the design surface and drone or survey epochs, progress per element, deviation map and the S-curve against the schedule.
City growth and land use
Built-up area per epoch 1975–2030 (GHS-BUILT-S), growth per decade, growth direction and new built-up patches; new buildings and roads in OpenStreetMap.
Energy asset inspections and O&M
Vegetation in line corridors by span, PV-table anomaly screening on orthophotos, work orders; thermal O&M and predictive maintenance are rolling out.
Disaster and infrastructure resilience (civil)
Before / after comparison for damaged buildings, roads and utilities and for humanitarian access — civil scope only: no military-operation tracking and no military object identification.
Maritime and transport observations
Planned: vessel and traffic feeds are not part of WaiMAP today.
Workflow
- Mark the area and pick two dates or sources
- Compare by swipe, blend or side by side
- Run the analysis for your sector
- Accept, reject or reclassify each change
- Issue the Observations report and work orders
Key deliverables
Report and tool names as they appear in WaiMAP.
How current is each source?
Update frequency, processing delay and licence differ per source — there is no single “real-time”.
| Source | Update frequency and delay |
|---|---|
| OpenStreetMap mapping changes | As often as you run a check; reflects community edits, which can lag reality by days to months. |
| Earthquakes (USGS) | Events of magnitude 3 and above usually appear within minutes to hours of the event. |
| Active fires (NASA FIRMS) | Satellite fire detections of the last 2 days; a few hours after the overpass; needs a FIRMS key. |
| Sentinel-2 imagery | The background is a cloudless mosaic (2016). The latest scenes (revisit about every 5 days, cloud cover permitting) appear only when the administrator configures the Copernicus layer. |
| Weather | Hourly forecast and reanalysis for trip and site conditions; reanalysis (ERA5) arrives with a delay of several days. |
| Drone orthophotos and point clouds | As often as you fly and upload them. |
| Built-up surface (GHS-BUILT-S R2023A, European Commission, JRC) | Epochs 1975, 1990, 2000, 2010, 2020 and the projections 2025 / 2030, about 1 km cells (CC BY 4.0). |
Capabilities
Checked against the code: what you can use today, what is being rolled out, and what is planned.
Available now
- Observation areas with reference date and checks (Personal and above)
- Mapping changes from OpenStreetMap
- Earthquakes (USGS) and active fires (NASA FIRMS)
- Drone orthophoto date comparison and PV defect screening
- Sentinel-2 cloudless background; latest Sentinel-2 scenes when configured
- Observations workspace: source time-line, swipe / blend / side-by-side, annotations
- Change detection between two images you provide, with confidence and human review (Personal and above)
- Urban growth from GHS-BUILT-S 1975–2030
- Design vs as-built volumes, progress and S-curve (Pro and above)
- Line-corridor vegetation and PV-field anomaly screening with work orders (Pro and above)
- Civil damage and humanitarian-access screening (no military use)
- A ready sample for every Observations item
Rolling out
- O&M and predictive maintenance, thermal inspections (Enterprise)
Planned
- Scheduled automatic checks and e-mail notifications
- Sentinel-2 change detection through the WAI Copernicus service
- Sector report templates and Observations API
- Maritime and transport feeds
Reports from this solution follow the WaiMAP report structure (executive summary, location, maps and layers, data sources and observation dates, results, constraints and changes, quantities and assumptions, findings and limitations, appendices) at screening, feasibility-grade or bankability-readiness level. Module details: capability matrix · validation report · Bankability & Data Trust.
Other industry solutions
Energy Intelligence
Solar, wind, storage, hydropower and the grid — from site screening to construction and operation.
Construction Intelligence
Terrain, earthworks, linear infrastructure, facilities and progress — planned versus actual.
Real Estate Intelligence
Parcels, constraints, infrastructure and development scenarios for land and property decisions.
Logistics Intelligence
HGV routes, vehicle limits, abnormal loads and project cargo to energy and construction sites.