 WaiMAP
Who WaiMAP is for
Four audiences, one platform. Pick yours: the problem it solves, what WaiMAP gives you, the outputs, and the demonstration to look at.
Project developers
Your problem
Many candidate sites and routes, little budget for surveys, and decisions needed before the land or the grid slot is gone.
What WaiMAP gives you
- Screen sites and routes in minutes with open data and your own files
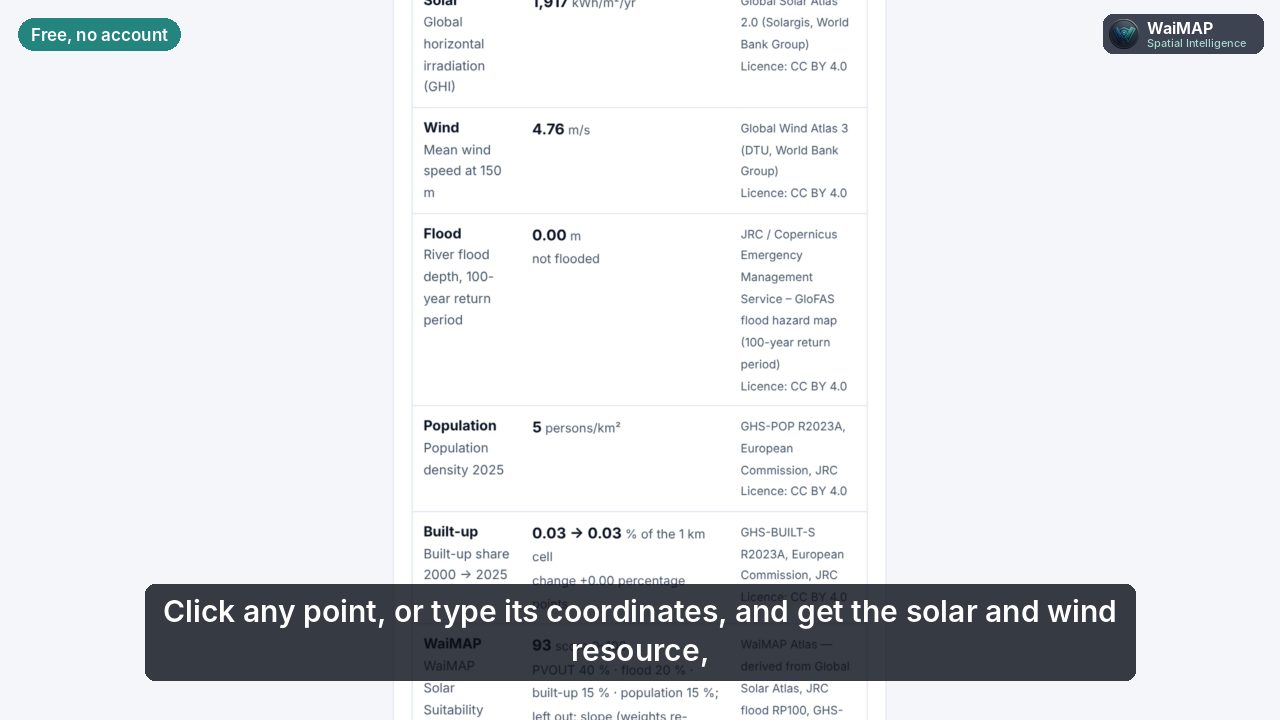
- Resource, layout, yield, grid connection options and cost in one project
- Data Trust levels that show what rests on measured data and what is still assumed
Outputs
Demonstration to look at
Mut, Mersin – solar PV plant (demonstration) Demonstration
 Video coming soon
Investors and lenders
Your problem
A model and a report arrive from the sponsor — which numbers rest on evidence, which on assumptions, and what is missing?
What WaiMAP gives you
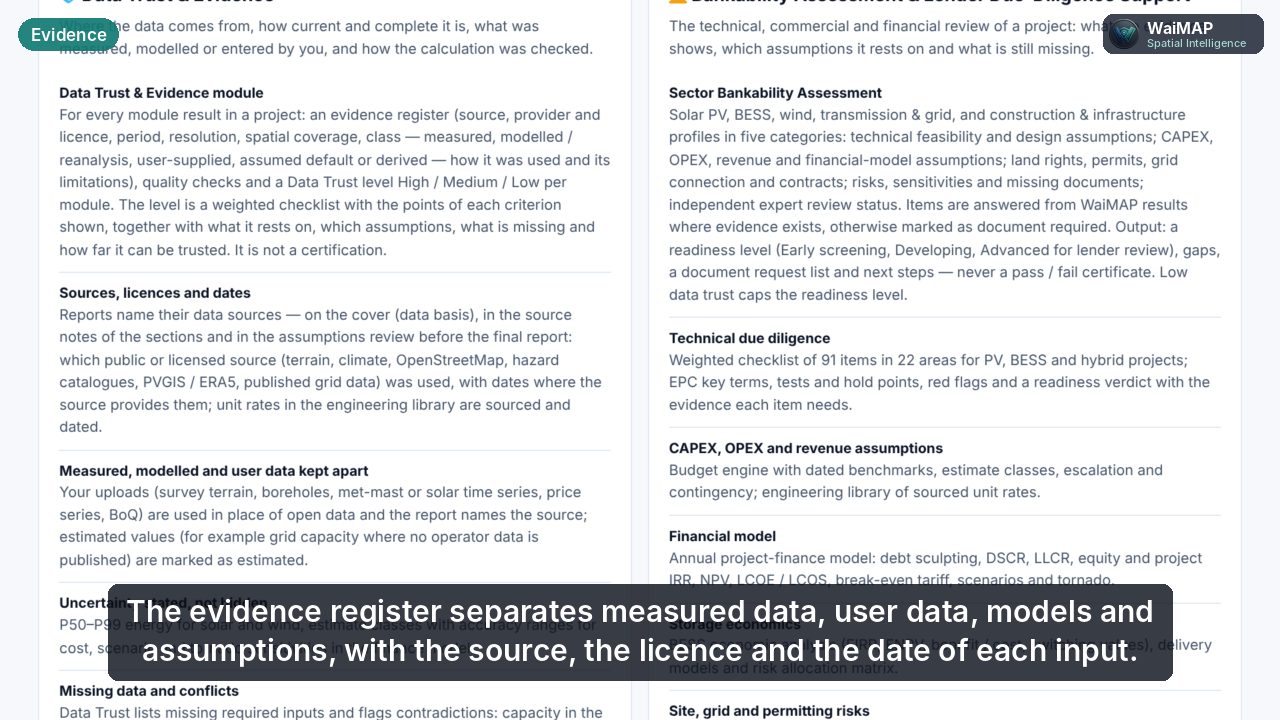
- The evidence register: sources, licences, dates, measured vs modelled vs assumed
- Independent engine cross-checks and the validation report
- Sensitivities, Monte Carlo P50 / P90 and estimate classes with accuracy ranges
Outputs
Demonstration to look at
Whitewell NPP – Bulgaria – Germany transmission corridor (demonstration) Demonstration
 Video coming soon
EPC contractors and engineering firms
Your problem
Bids with short deadlines: quantities, routes and costs before the design is done — and hand-over formats your designers can use.
What WaiMAP gives you
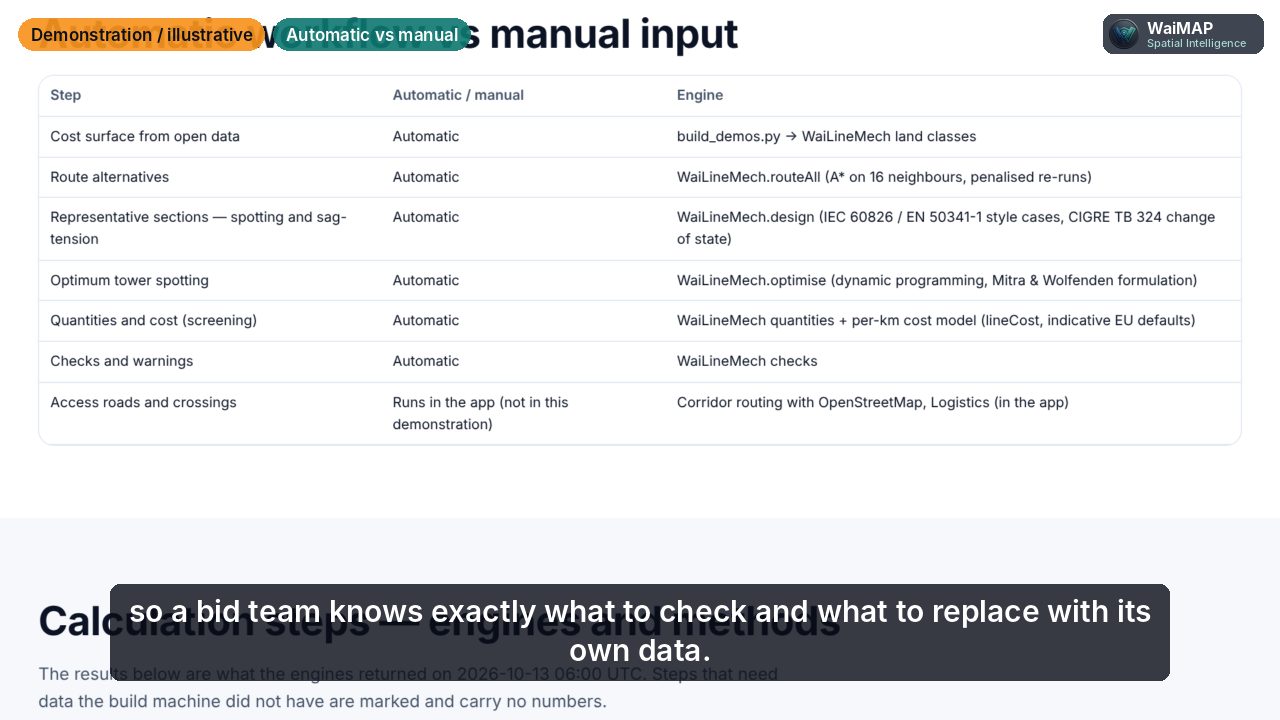
- Tower spotting, sag-tension, earthworks, layouts and BoQ from engines with stated methods
- Your own unit prices and estimate classes
- DXF / DWG / IFC exports, WHT Exchange v1 and the CAD / BIM bridge (in testing)
Outputs
Demonstration to look at
Whitewell NPP – Bulgaria – Germany transmission corridor (demonstration) Demonstration
 Video coming soon
Employers and asset owners
Your problem
Projects in construction and assets in operation: is the work progressing as designed, and what changed around the site?
What WaiMAP gives you
- Observation areas with alerts, change detection with human review
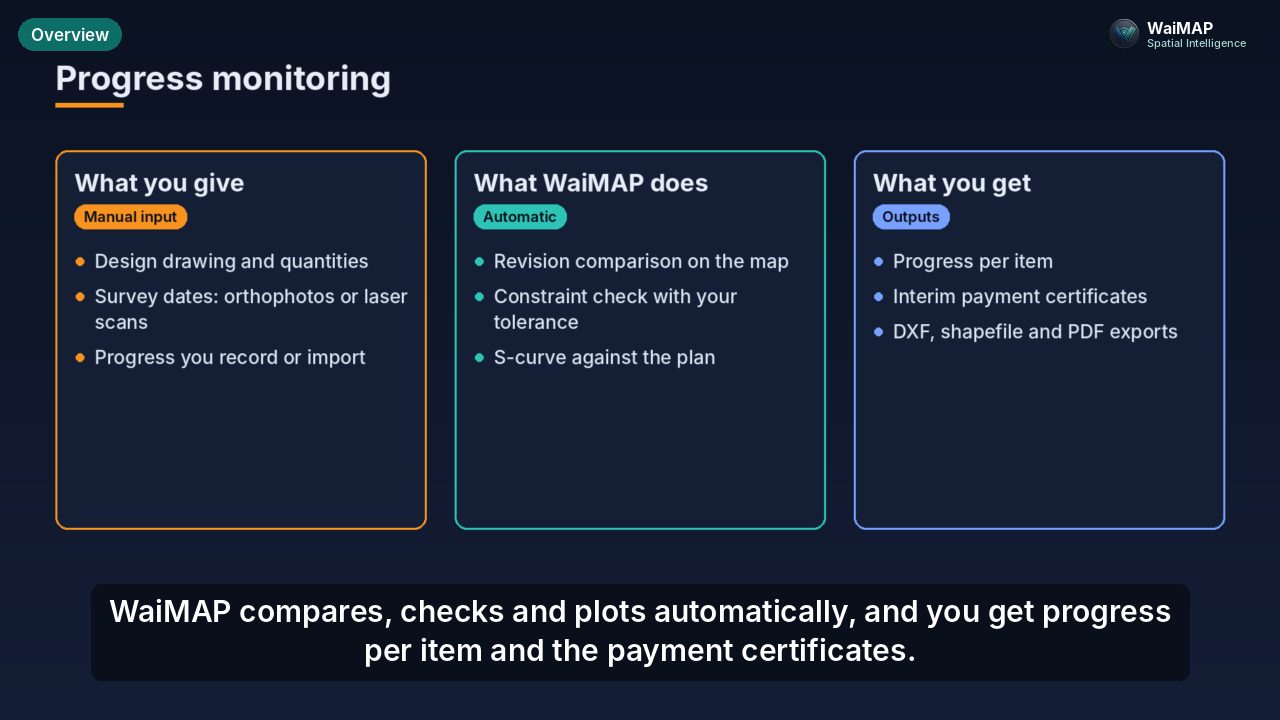
- Drone orthophotos and point clouds: progress volumes and S-curve against the plan
- Named drawing revisions compared on the map
Outputs
Demonstration to look at
Red Sea coastal development – Jeddah area (demonstration) Demonstration
 Video coming soon