 WaiMAP
Renewables, Power Infrastructure & Energy Storage
Find and compare sites, design plants and connections, estimate energy, cost and returns, and follow construction — one project, one map, with the evidence behind every number.
For: Developers, IPPs, utilities and TSOs, EPC contractors, investors
What you give WaiMAP
- A point, a site boundary or a route A → B
- Plant size and equipment choices (modules, turbines, conductor, storage hours)
- Optional: your own data — met-mast or solar time series, price series, survey DEM, CAD / IFC drawings, unit prices
What it does
Automatic
- Resource from the atlas, PVGIS / NASA POWER and your data
- PV layout, stringing and cabling; wind layout and wakes
- Least-cost route alternatives, simple and optimum tower spotting, sag-tension, clearance and tower loads
- Substation estimate with single-line diagram; quantities and Class 4–5 cost; project finance
Manual input
- Choose the equipment and design criteria
- Enter or confirm your unit prices
- Confirm the route, angle points and assumptions before the report
What you get
- Technical, cost and feasibility reports (PDF, Word, PowerPoint, HTML)
- Excel calc sheets and BoQ
- DXF / DWG / IFC drawings, KML / GeoJSON
- Data Trust appendix and Bankability Assessment (supports bankability — no lender approval)
Planned
- Dam and reservoir hydropower engineering
Demonstration project
Demonstration project (generated with WaiMAP engines)
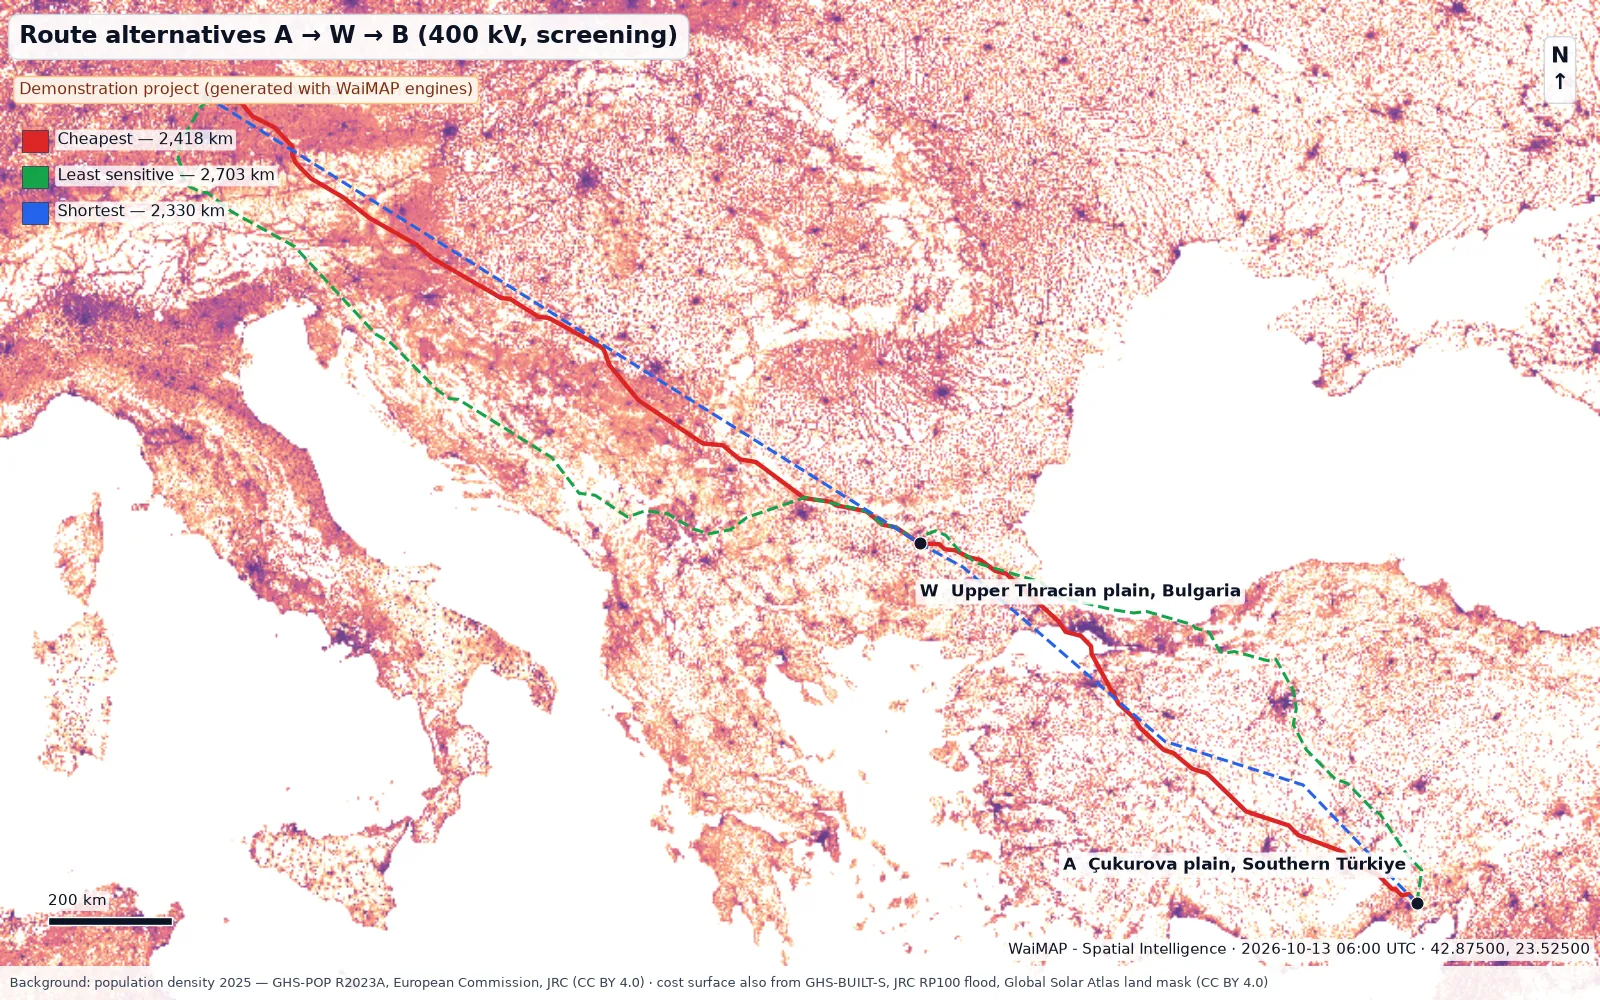
Whitewell NPP – Bulgaria – Germany transmission corridor (demonstration)
A 400 kV corridor of about 2,418 km screened with the WaiMAP line engines: three route alternatives on an open-data cost surface, three representative 10 km sections with spotting, sag-tension, quantities, optimum spotting and checks.
Video
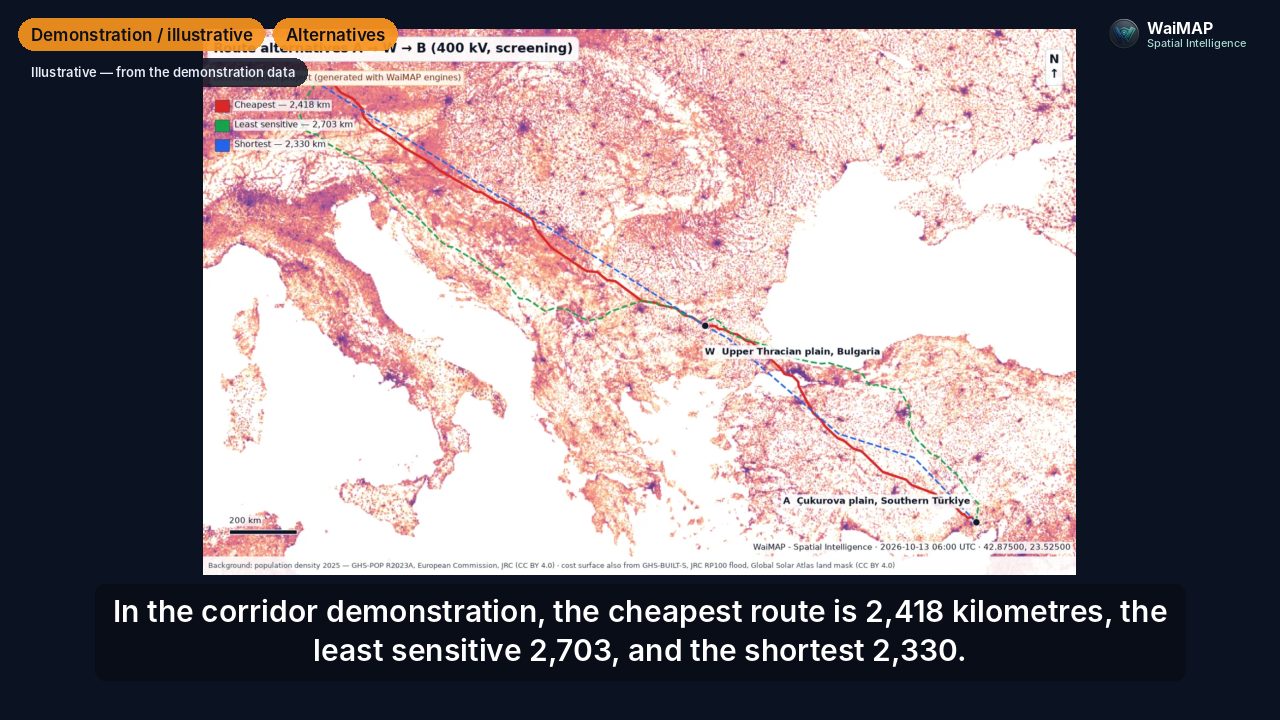 Video coming soon
Videos are published after review. Video centre
Who it is for
- Renewable developers and IPPs
- EPC contractors and owner's engineers
- Utilities and transmission operators
- Investors, lenders and technical advisers
Key output: Site suitability, engineering insights, project maps, feasibility inputs and monitoring reports.
Use cases
Solar PV and wind
Hourly yield with P50–P99, layouts, stringing and cabling for PV; NASA POWER or met-mast wind with long-term correction, wakes and layout optimisation.
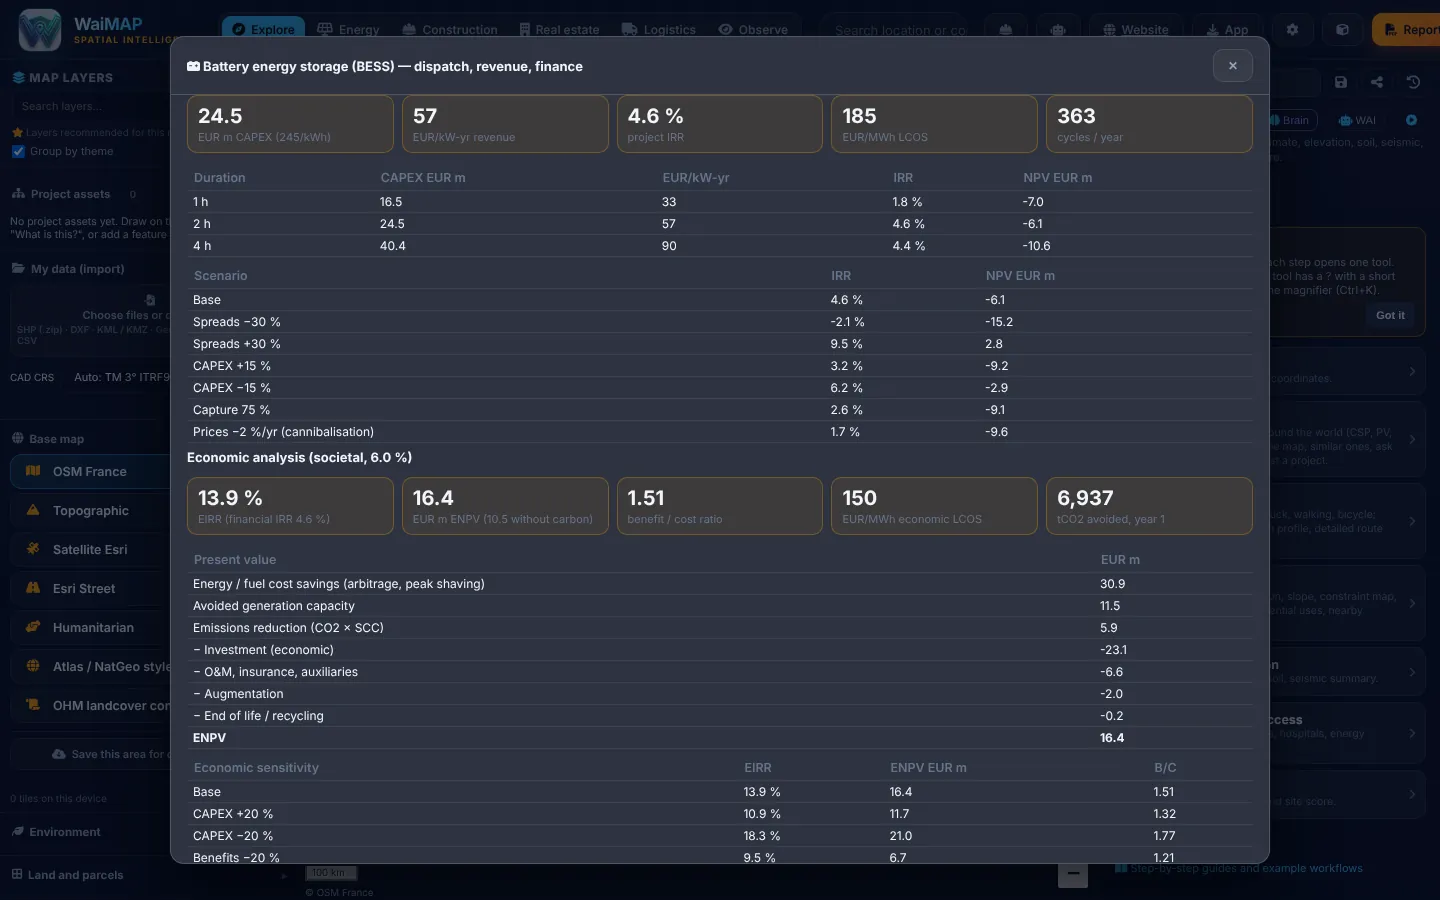
Battery storage (BESS)
Market dispatch, revenue stack, degradation and augmentation, LCOS, finance and economic analysis.
Hydropower
Run-of-river: flow duration curve, design flow, waterway hydraulics, turbines, energy, BoQ and finance.
Transmission lines and substations
Least-cost routes, sag-tension and clearances, optimum tower spotting, substation configuration, SLD and CAPEX.
Terrain, access roads and site preparation
Platforms and cut / fill alternatives, drainage, mass haul, abnormal-load access for blades and transformers.
Construction progress and operational monitoring
Drone orthophotos and point clouds, progress against plan, observation areas around operating sites.
Across the project lifecycle
One project from the first screening to operation — the same map, data and drawing at every stage.
Development & Feasibility
Site screening, resource, grid connection options, land → capacity, 8-axis go / no-go, finance.
Design & Engineering
Plant layout and electrical design, line mechanics, substation estimate, terrain and drainage design, BoQ.
Construction & Commissioning
Progress S-curve, interim payment certificates, drone surveys, revisions of the project drawing.
Operations & Maintenance
Observation areas, PV defect screening on drone orthophotos; predictive O&M is rolling out.
Workflow
- Pick or import the site
- Screen resource, grid and constraints
- Design the plant and the connection
- Run yield, cost and finance
- Check Data Trust and readiness
- Issue the report and follow construction
Key deliverables
Report and tool names as they appear in WaiMAP.
Capabilities
Checked against the code: what you can use today, what is being rolled out, and what is planned.
Available now
- Solar PV yield, layout, stringing, cabling and PVsyst hand-over
- Wind yield, wakes (Jensen / Gaussian), layout optimisation, P50–P99
- BESS dispatch, revenue stack, finance and economics
- Run-of-river hydropower
- Grid connection screening, load flow, IEC 60909 short circuit, N-1
- Line routing, sag-tension, clearances, optimum tower spotting
- Substation estimator with SLD and BoQ
- Energy hub, green hydrogen, CSP, combined cycle
- Terrain Design Studio, drainage and mass haul for platforms and roads
- Drone orthophotos, point clouds, progress and payments
- PV defect screening on drone orthophotos (with WAI)
- Data Trust & Evidence and sector Bankability Assessment
- Stress test & weak links: regional hazards → element utilisation → weakest links; FEM (PV tables, lattice towers), harmonics, surge and protection grading (Team and above)
- Project 3D: towers with catenary conductors, turbines, PV tables, substations and point clouds at real dimensions (Pro and above); section, clearance display and stress overlay (Team and above)
- Dynamic studies: modal, response spectrum (EN 1998-1 / TBDY 2018), time history, wind turbine Campbell check, conductor vibration, transient stability and CCT, foundation settlement (Team and above)
- Resource & hazard atlas on the map: Global Solar / Wind Atlas (incl. wind speed 150 m), population density (GHSL) and 100-year river flood depth (JRC / Copernicus) — in point reports, Data Trust, stress test and site screening
- Engineering cockpit: KPIs with their source module, status matrix, ranked next steps, tornado / spider sensitivities as engine runs, calc sheets; Monte Carlo P50 / P75 / P90 of energy, NPV and IRR (Pro and above)
Rolling out
- O&M and predictive maintenance (Enterprise)
Planned
- Dam and reservoir hydropower engineering
Reports from this solution follow the WaiMAP report structure (executive summary, location, maps and layers, data sources and observation dates, results, constraints and changes, quantities and assumptions, findings and limitations, appendices) at screening, feasibility-grade or bankability-readiness level. Module details: capability matrix · validation report · Bankability & Data Trust.
Other industry solutions
Construction Intelligence
Terrain, earthworks, linear infrastructure, facilities and progress — planned versus actual.
Real Estate Intelligence
Parcels, constraints, infrastructure and development scenarios for land and property decisions.
Logistics Intelligence
HGV routes, vehicle limits, abnormal loads and project cargo to energy and construction sites.
Observations & Monitoring
Observe → Compare → Interpret → Alert & Report, for sites, assets and their surroundings.