 WaiMAP
From Site Selection to Construction and Handover
Model the terrain, compare earthwork scenarios, estimate quantities, revise the project drawing and track progress with drone surveys — every change visible on the map.
For: EPC and general contractors, engineering consultants, project owners, surveyors
What you give WaiMAP
- A site boundary, a corridor or your CAD / IFC drawing
- Your survey DEM, boreholes, drone orthophotos or point clouds (optional)
- Design levels, slopes and unit prices
What it does
Automatic
- Platform levels: balanced level or best-fit plane, batters, retaining walls
- Mass haul optimisation (exact solver), fleet, fuel and CO₂
- Corridor routing and pipeline hydraulics; site drainage and storm sewers
- Quantities, BoQ and budget; progress volumes and S-curve from drone surveys
Manual input
- Draw or import the layout and set the design levels
- Map CAD layers to WaiMAP element types on import
- Accept or reject detected changes and progress items
What you get
- Earthwork scenarios and mass haul plan
- DXF R2018 / DWG R2000 / IFC 4.3 exports and WHT Exchange v1
- BoQ, budget and interim payment certificates
- Progress and revision-compare reports
Planned
- Issued-for-construction drawings
- Native RVT read without IFC (only through the CAD / BIM bridge, in testing)
Demonstration project
Demonstration project (generated with WaiMAP engines)
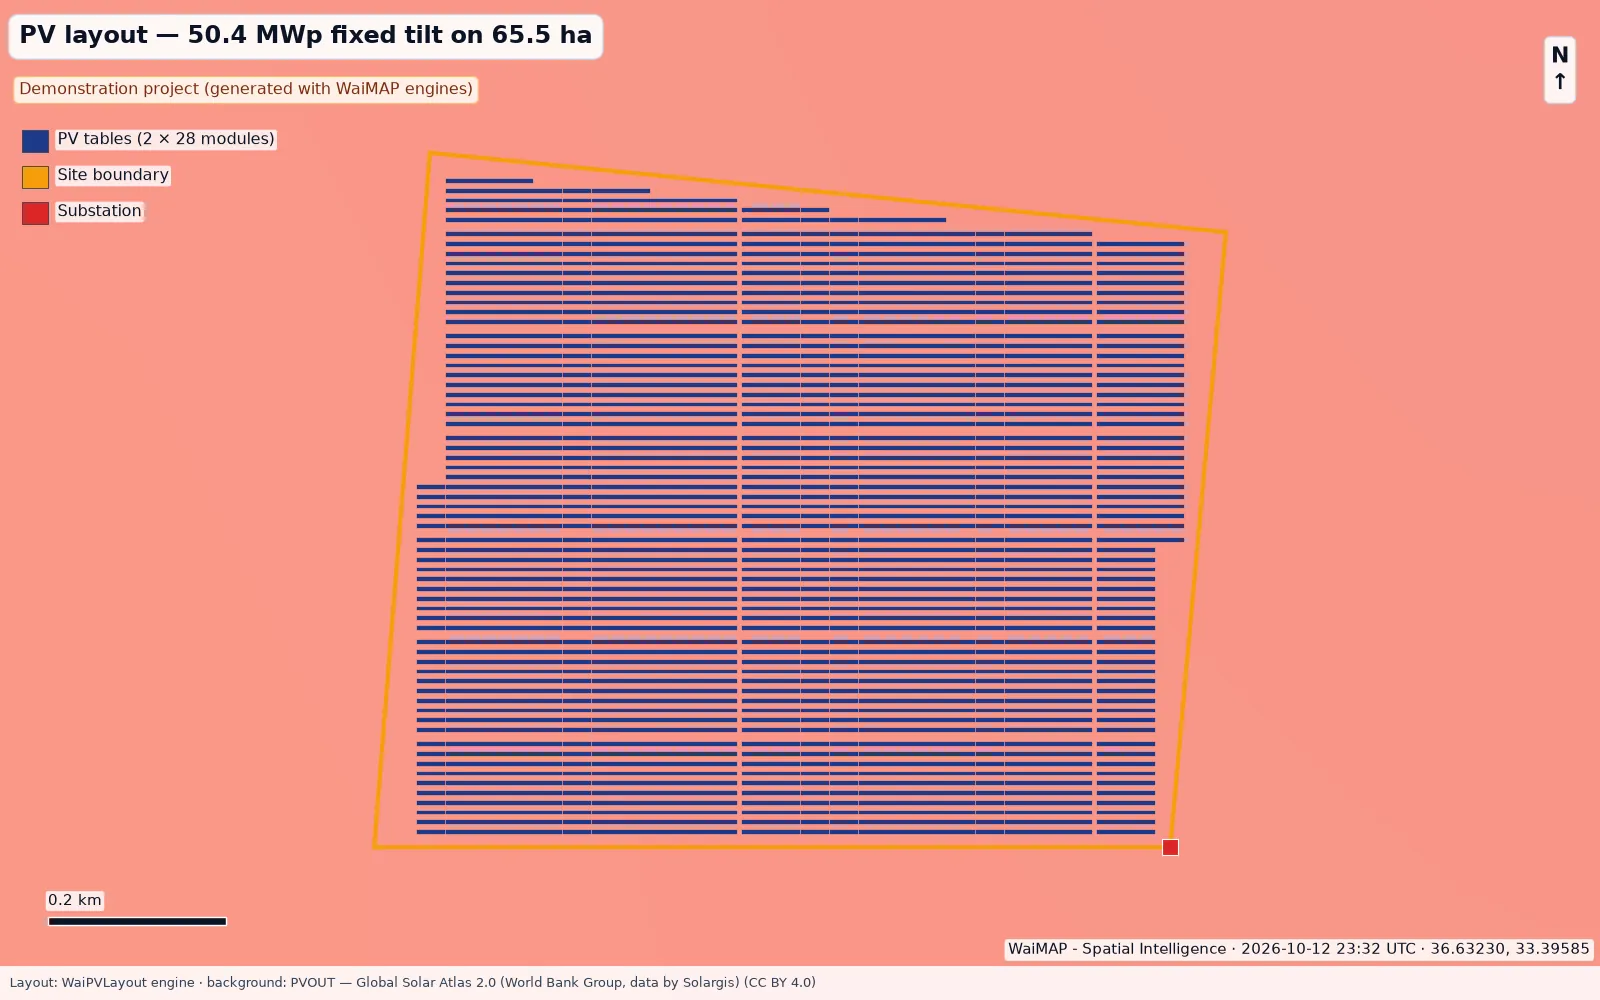
Mut, Mersin – solar PV plant (demonstration)
A ≈ 50.4 MWp fixed-tilt PV plant on a ≈ 65.5 ha demonstration parcel: layout, cabling, BoQ and Class 4 CAPEX, pvlib yield on free data (95.4 GWh/yr), site conditions, roads and a BESS option.
Video
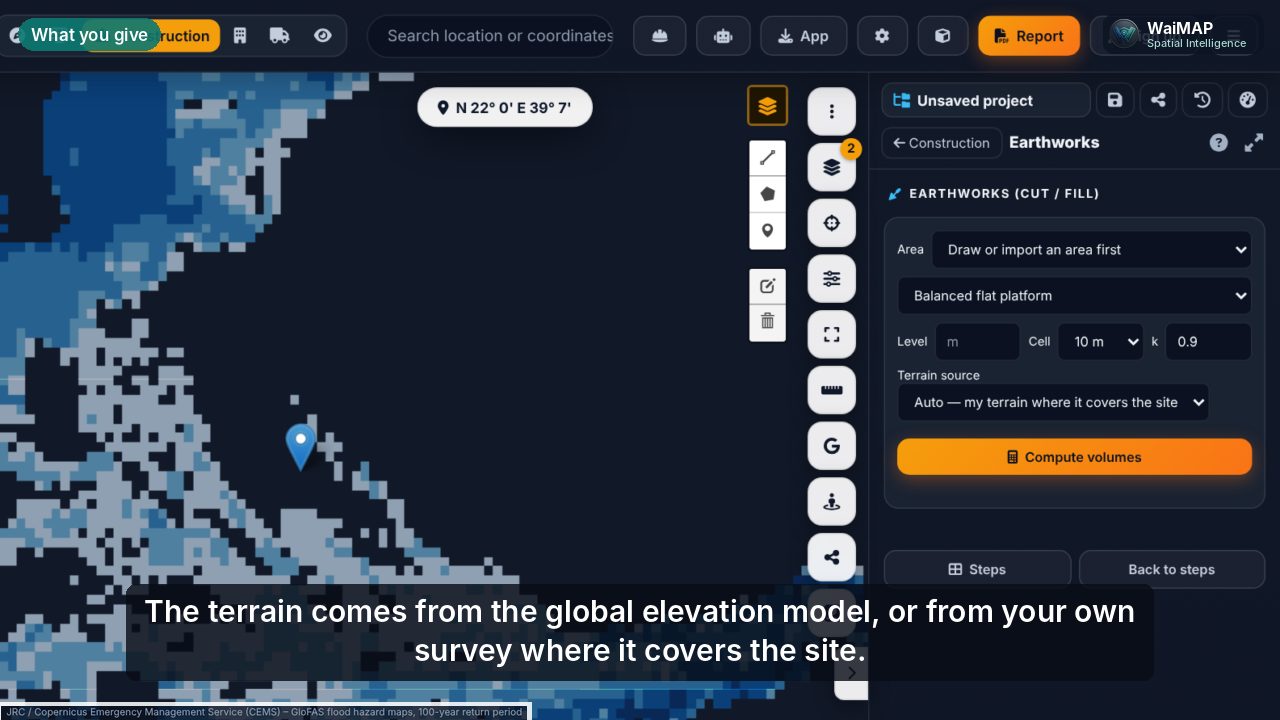 Video coming soon
Videos are published after review. Video centre
Who it is for
- General and EPC contractors
- Engineering consultants and designers
- Project owners and project management offices
- Surveyors and site teams
Key output: Site analysis, earthwork scenarios, quantity estimates, progress reports and georeferenced documentation.
Use cases
Terrain modelling, excavation and filling
Your survey DEM or the global DEM, platform level alternatives, batters, retaining walls, swell / shrink and haul cost.
Roads, highways, railways and pipelines
Least-cost corridors, elevation profiles, pipeline hydraulics, hazards along the route, crossings.
Industrial facilities, buildings and infrastructure
Mini CAD with typed assets, site drainage, water and fire-water networks, storm sewers, ground model.
Drone surveys and progress tracking
Orthophotos and point clouds, DTM / DSM, stockpile and progress volumes, survey accuracy QA, site photo log.
Planned versus actual
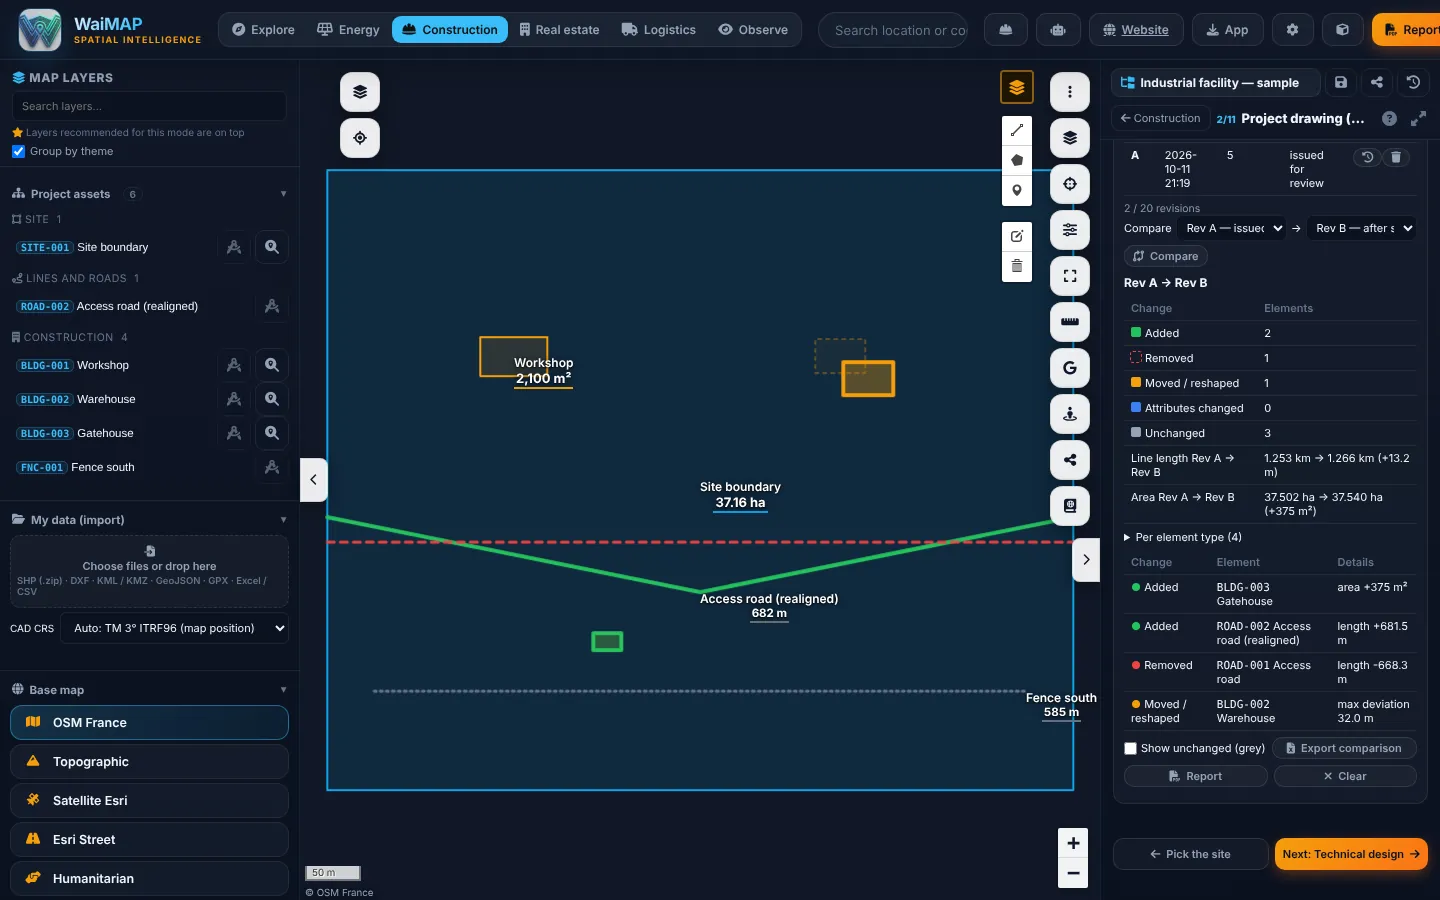
Named revisions Rev A, B, C … compared on the map: added, removed, moved, with deviations in metres and length / area changes.
Georeferenced documentation
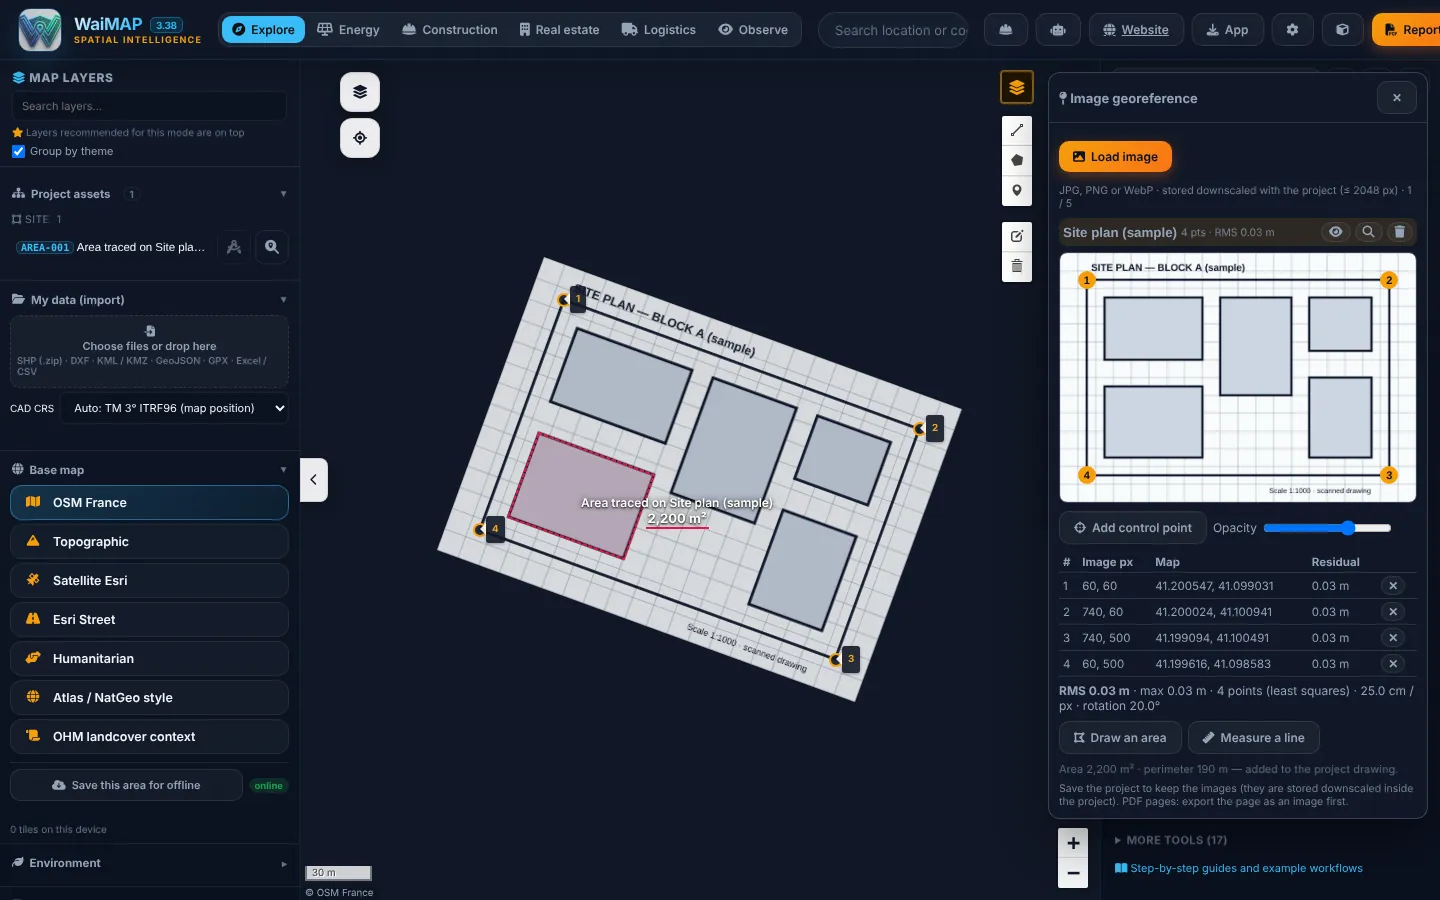
Scanned plans and photos placed on the map by control points (RMS shown), then traced and measured into the project drawing.
Across the project lifecycle
One project from the first screening to operation — the same map, data and drawing at every stage.
Development & Feasibility
Site analysis, constraints, ground model desk study, hazard screening, Class 5–4 cost estimate.
Design & Engineering
Earthwork scenarios, mass haul plan, drainage design, quantities and BoQ, project drawing with revisions.
Construction & Commissioning
Drone surveys, progress S-curve, interim payment certificates, revision compare, daily logs.
Operations & Maintenance
Observation areas around the asset, handover documents and drawings in standard formats.
Workflow
- Draw or import the site
- Load terrain, ground and constraints
- Compare earthwork and layout scenarios
- Estimate quantities and cost
- Save revisions and track progress
- Issue reports and hand over drawings
Key deliverables
Report and tool names as they appear in WaiMAP.
In the app
Capabilities
Checked against the code: what you can use today, what is being rolled out, and what is planned.
Available now
- Terrain Design Studio: platforms, batters, retaining walls, haul, cost
- Mass haul optimisation (borrow / spoil, fleet, fuel, CO₂)
- Terrain hydrology, site drainage and storm sewers
- Ground model, excavation classes and borehole plan
- Corridor routing and pipeline hydraulics
- Mini CAD with typed assets, multi-select and group edits
- Named revisions and revision compare on the map (Pro and above)
- Image georeference: plans and photos on the map by control points (Personal and above)
- Drone orthophotos, point clouds, stockpile and progress volumes
- Progress S-curve and interim payment certificates
- BoQ, programme and budget engine
- Stress test & weak links, FEM frames and pipeline surge (Team and above)
- Project 3D: buildings, pipes at burial depth, platforms and point clouds in 3D (Pro and above); vertical sections with dimensions (Team and above)
- Dynamic studies: modal, response spectrum, time history and foundation settlement (Team and above)
- 100-year river flood depth per element (JRC / Copernicus) and population around the site (GHSL) in the stress test, ground hazards and site screening
Rolling out
- Self-service team user management
Planned
- Construction drawings and issued-for-construction design
Reports from this solution follow the WaiMAP report structure (executive summary, location, maps and layers, data sources and observation dates, results, constraints and changes, quantities and assumptions, findings and limitations, appendices) at screening, feasibility-grade or bankability-readiness level. Module details: capability matrix · validation report · Bankability & Data Trust.
Other industry solutions
Energy Intelligence
Solar, wind, storage, hydropower and the grid — from site screening to construction and operation.
Real Estate Intelligence
Parcels, constraints, infrastructure and development scenarios for land and property decisions.
Logistics Intelligence
HGV routes, vehicle limits, abnormal loads and project cargo to energy and construction sites.
Observations & Monitoring
Observe → Compare → Interpret → Alert & Report, for sites, assets and their surroundings.