Istanbul
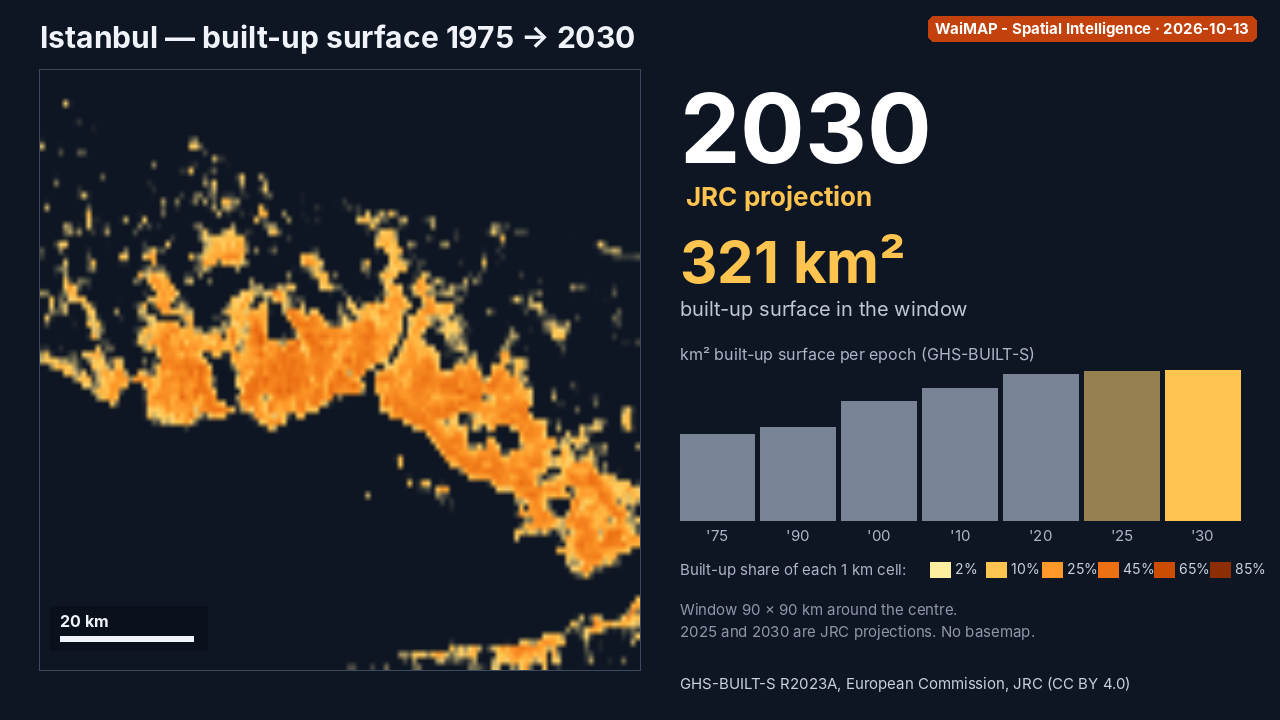
| Epoch | 1975 | 1990 | 2000 | 2010 | 2020 | 2025* | 2030* |
|---|---|---|---|---|---|---|---|
| Built-up surface, km² | 182 | 199 | 254 | 282 | 310 | 317 | 321 |
* JRC projection. Window: 90 × 90 km around 41.03, 28.95 (a fixed square, not a city boundary).
 WaiMAP
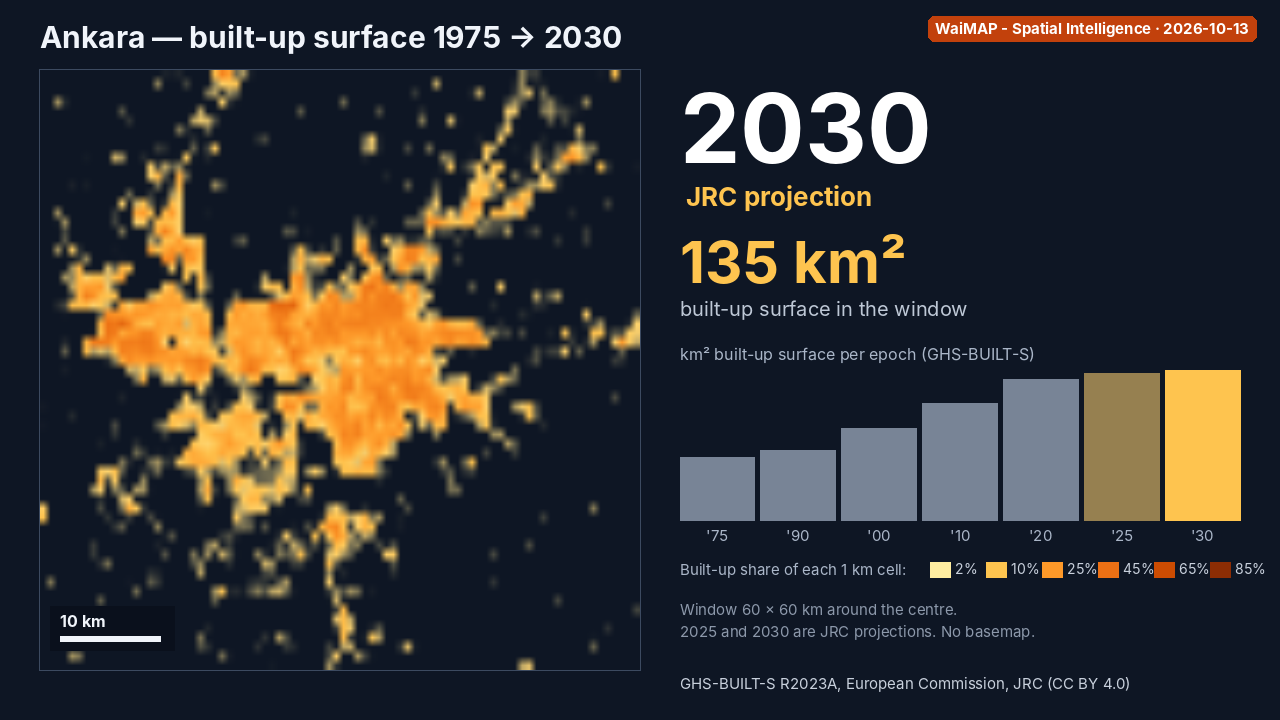
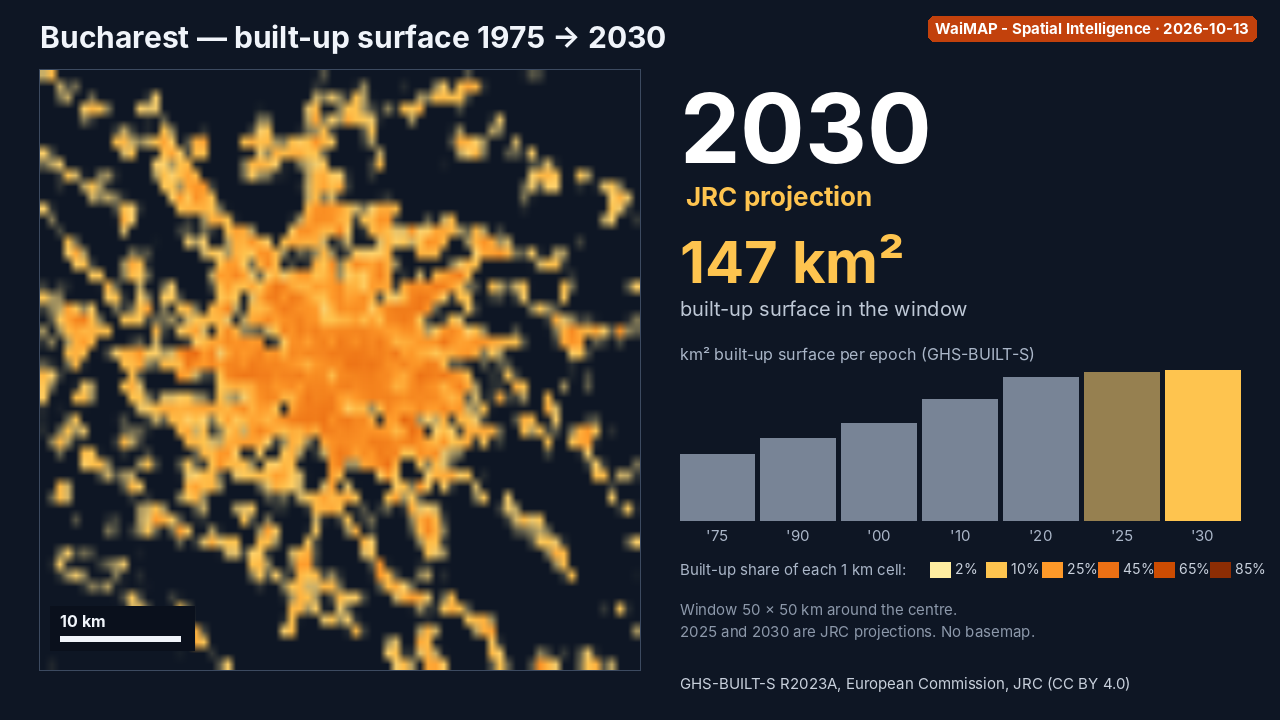
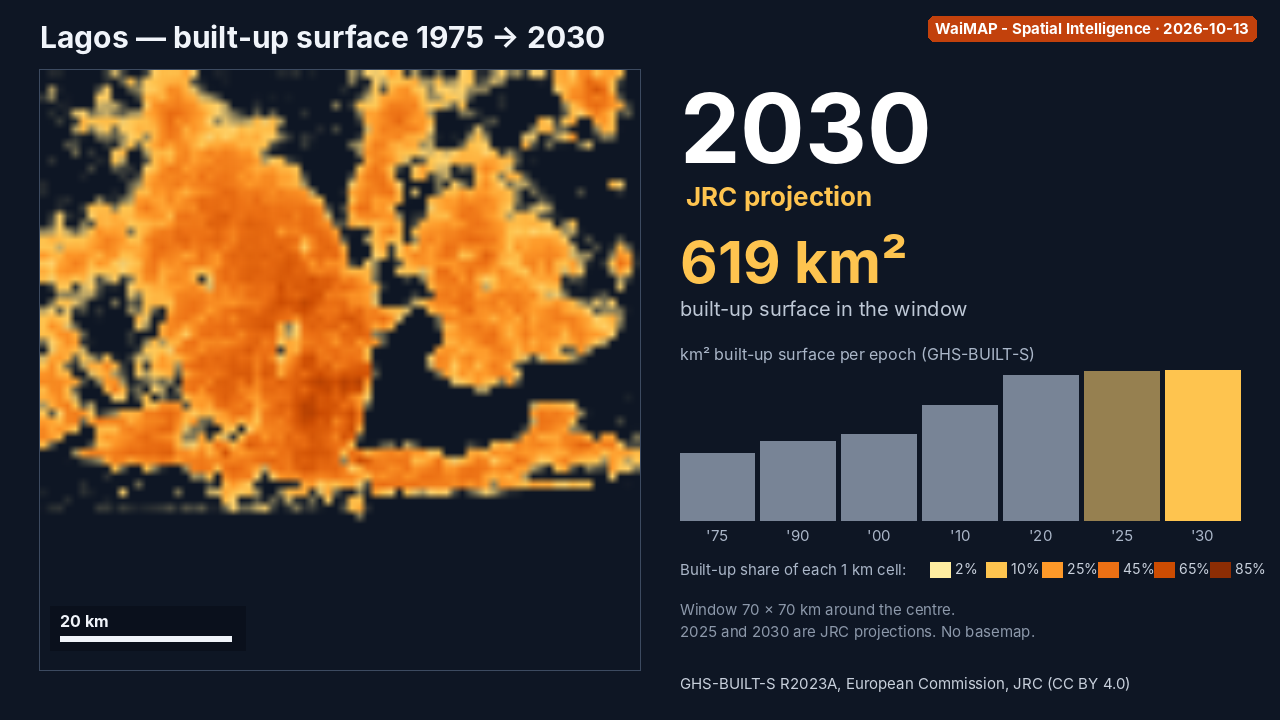
The built-up surface of 4 cities, epoch by epoch — 1975, 1990, 2000, 2010, 2020 and the JRC projections for 2025 and 2030 — rendered by WaiMAP from the GHS-BUILT-S R2023A grid. Every number on this page comes from the same file as the animations.
Built-up km² = Σ (built-up share of each 30" cell × cell area) inside a square window around the city centre (cell area from the latitude). 2025 and 2030 are JRC projections. The window is a fixed square, not an administrative boundary.
| Epoch | 1975 | 1990 | 2000 | 2010 | 2020 | 2025* | 2030* |
|---|---|---|---|---|---|---|---|
| Built-up surface, km² | 182 | 199 | 254 | 282 | 310 | 317 | 321 |
* JRC projection. Window: 90 × 90 km around 41.03, 28.95 (a fixed square, not a city boundary).
| Epoch | 1975 | 1990 | 2000 | 2010 | 2020 | 2025* | 2030* |
|---|---|---|---|---|---|---|---|
| Built-up surface, km² | 56 | 62 | 83 | 105 | 127 | 132 | 135 |
* JRC projection. Window: 60 × 60 km around 39.93, 32.82 (a fixed square, not a city boundary).
| Epoch | 1975 | 1990 | 2000 | 2010 | 2020 | 2025* | 2030* |
|---|---|---|---|---|---|---|---|
| Built-up surface, km² | 65 | 80 | 95 | 118 | 140 | 144 | 147 |
* JRC projection. Window: 50 × 50 km around 44.43, 26.10 (a fixed square, not a city boundary).
| Epoch | 1975 | 1990 | 2000 | 2010 | 2020 | 2025* | 2030* |
|---|---|---|---|---|---|---|---|
| Built-up surface, km² | 273 | 322 | 351 | 470 | 598 | 611 | 619 |
* JRC projection. Window: 70 × 70 km around 6.55, 3.38 (a fixed square, not a city boundary).
Data: GHS-BUILT-S R2023A, European Commission, JRC (CC BY 4.0). No basemap: no licence-safe coastline or country outline at city scale is available on the build machine (the only local outline, Natural Earth 1:110m, is too coarse for these windows). No third-party map tiles are used in the media. Stamp: WaiMAP - Spatial Intelligence. Generated 2026-10-13 by tools/growth/build_growth_media.py — the numbers: growth.json.